works

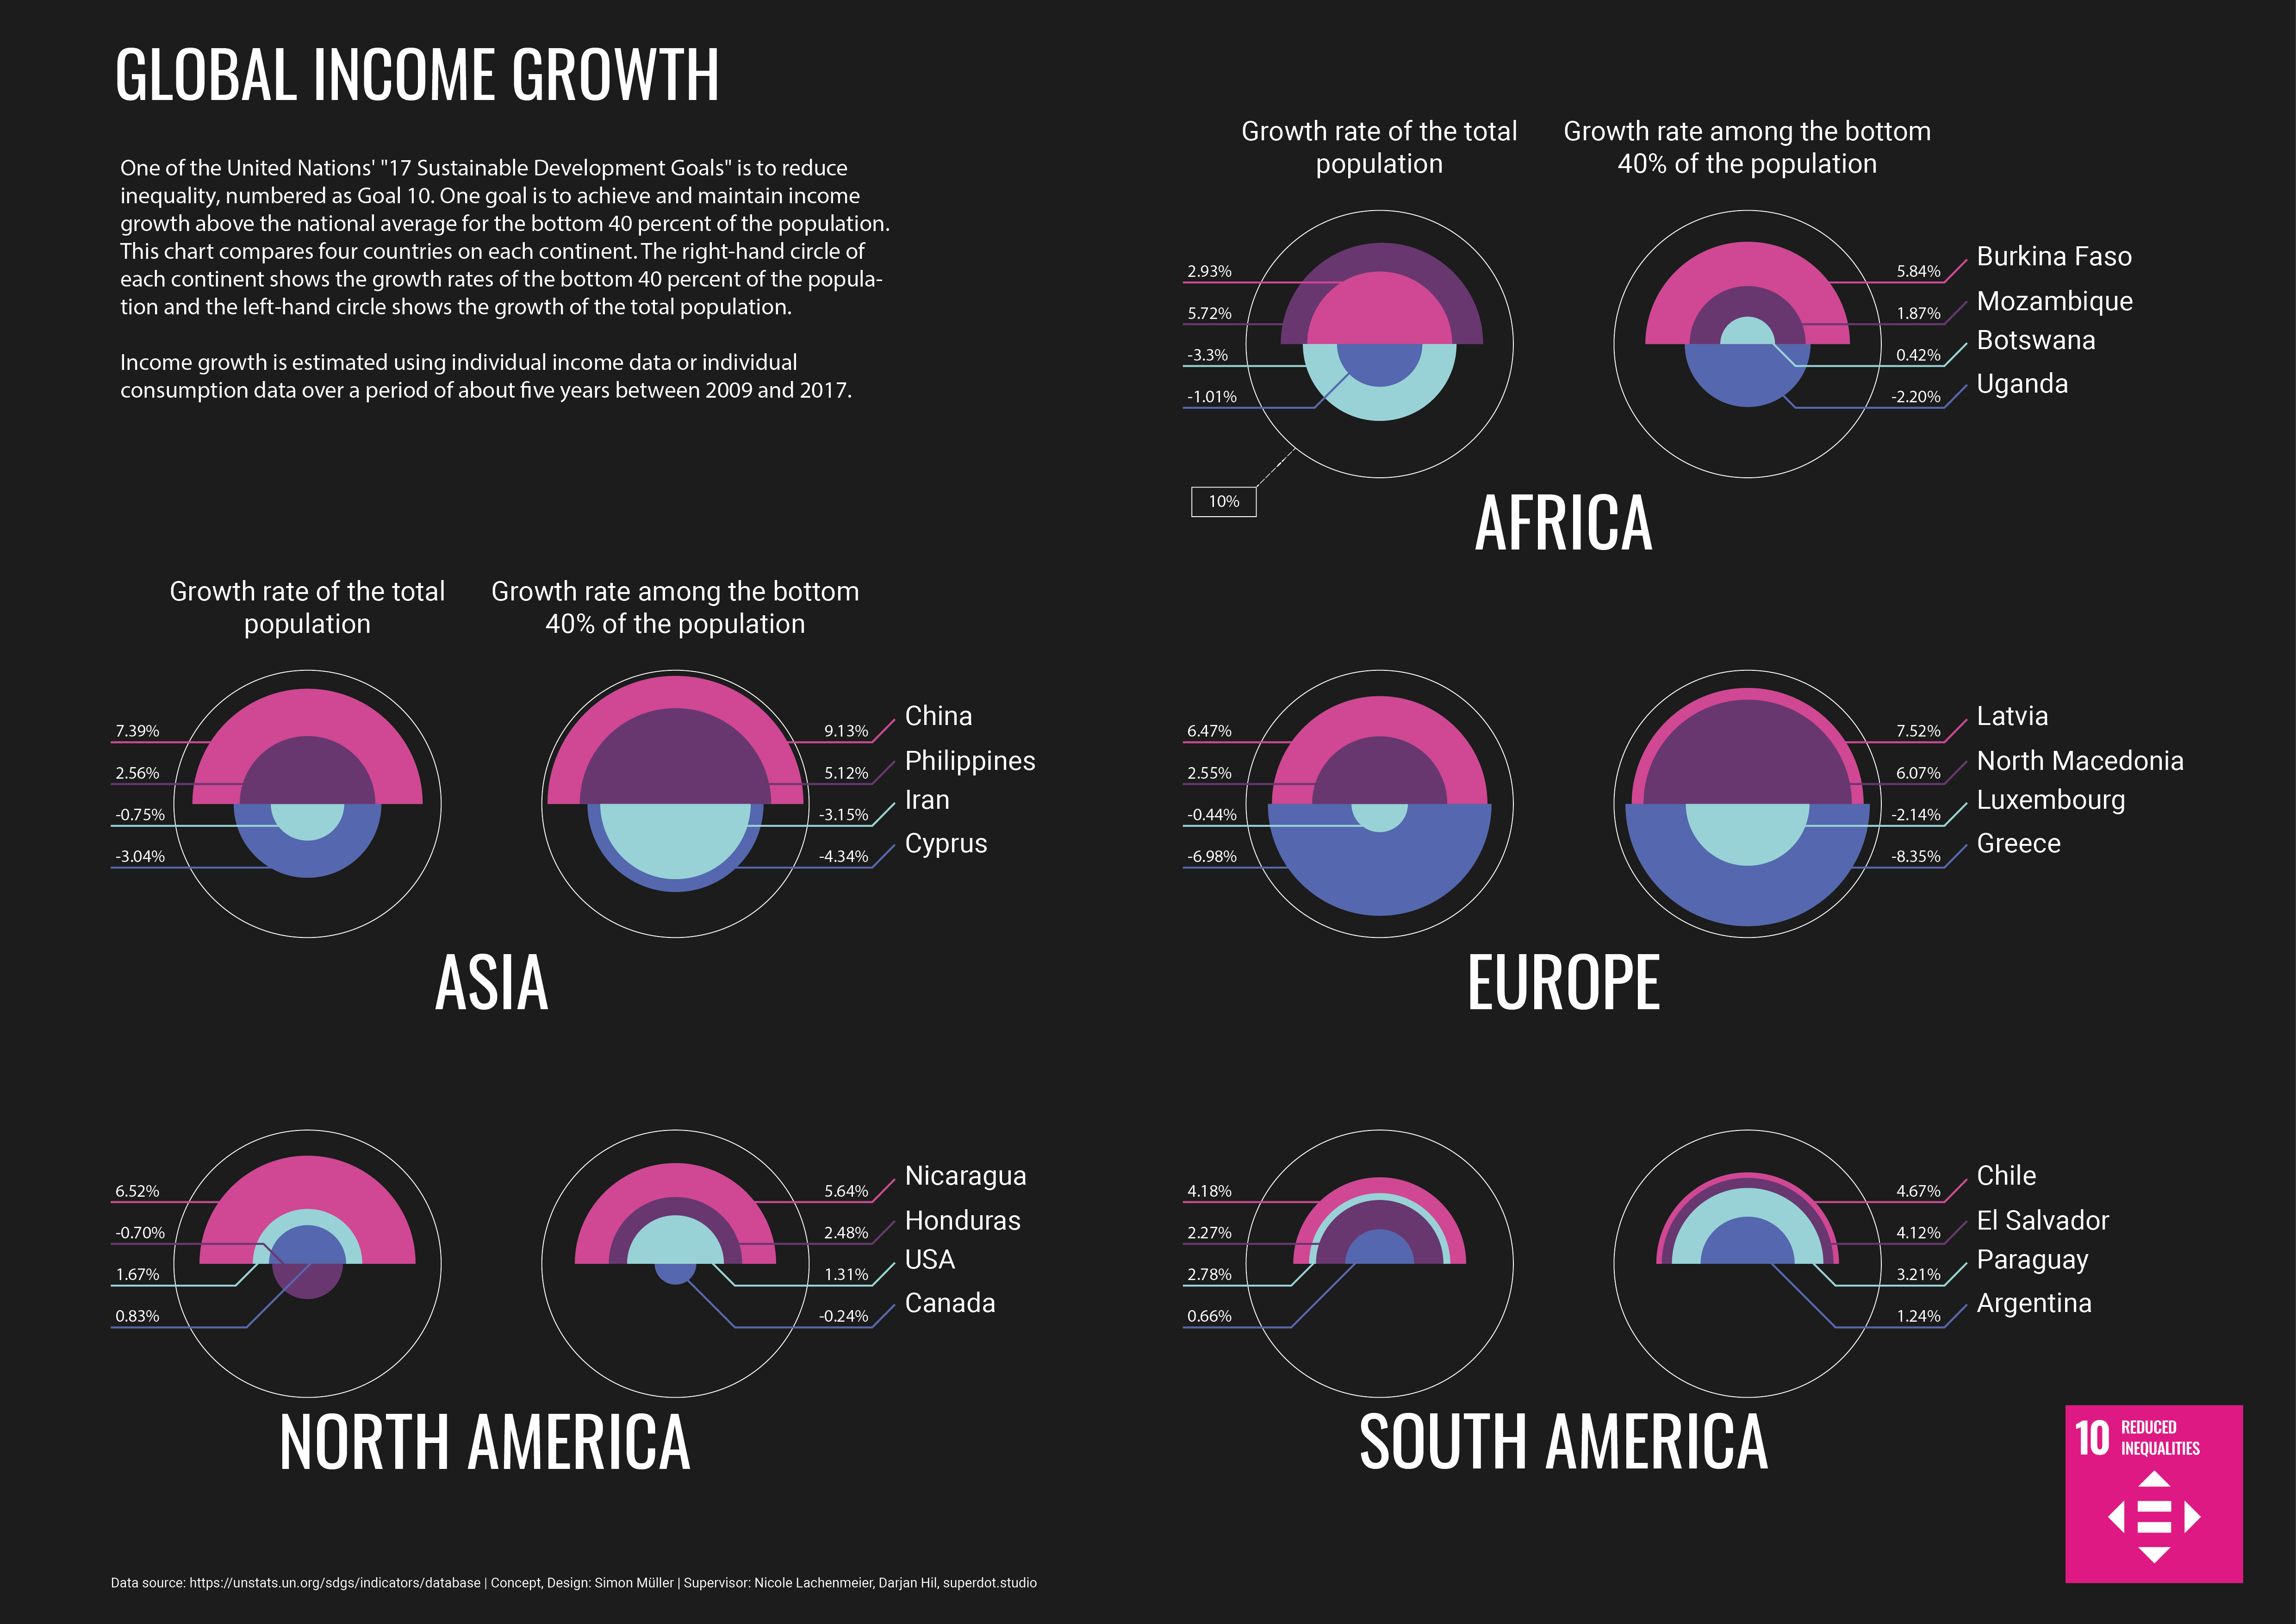
Global Income Growth
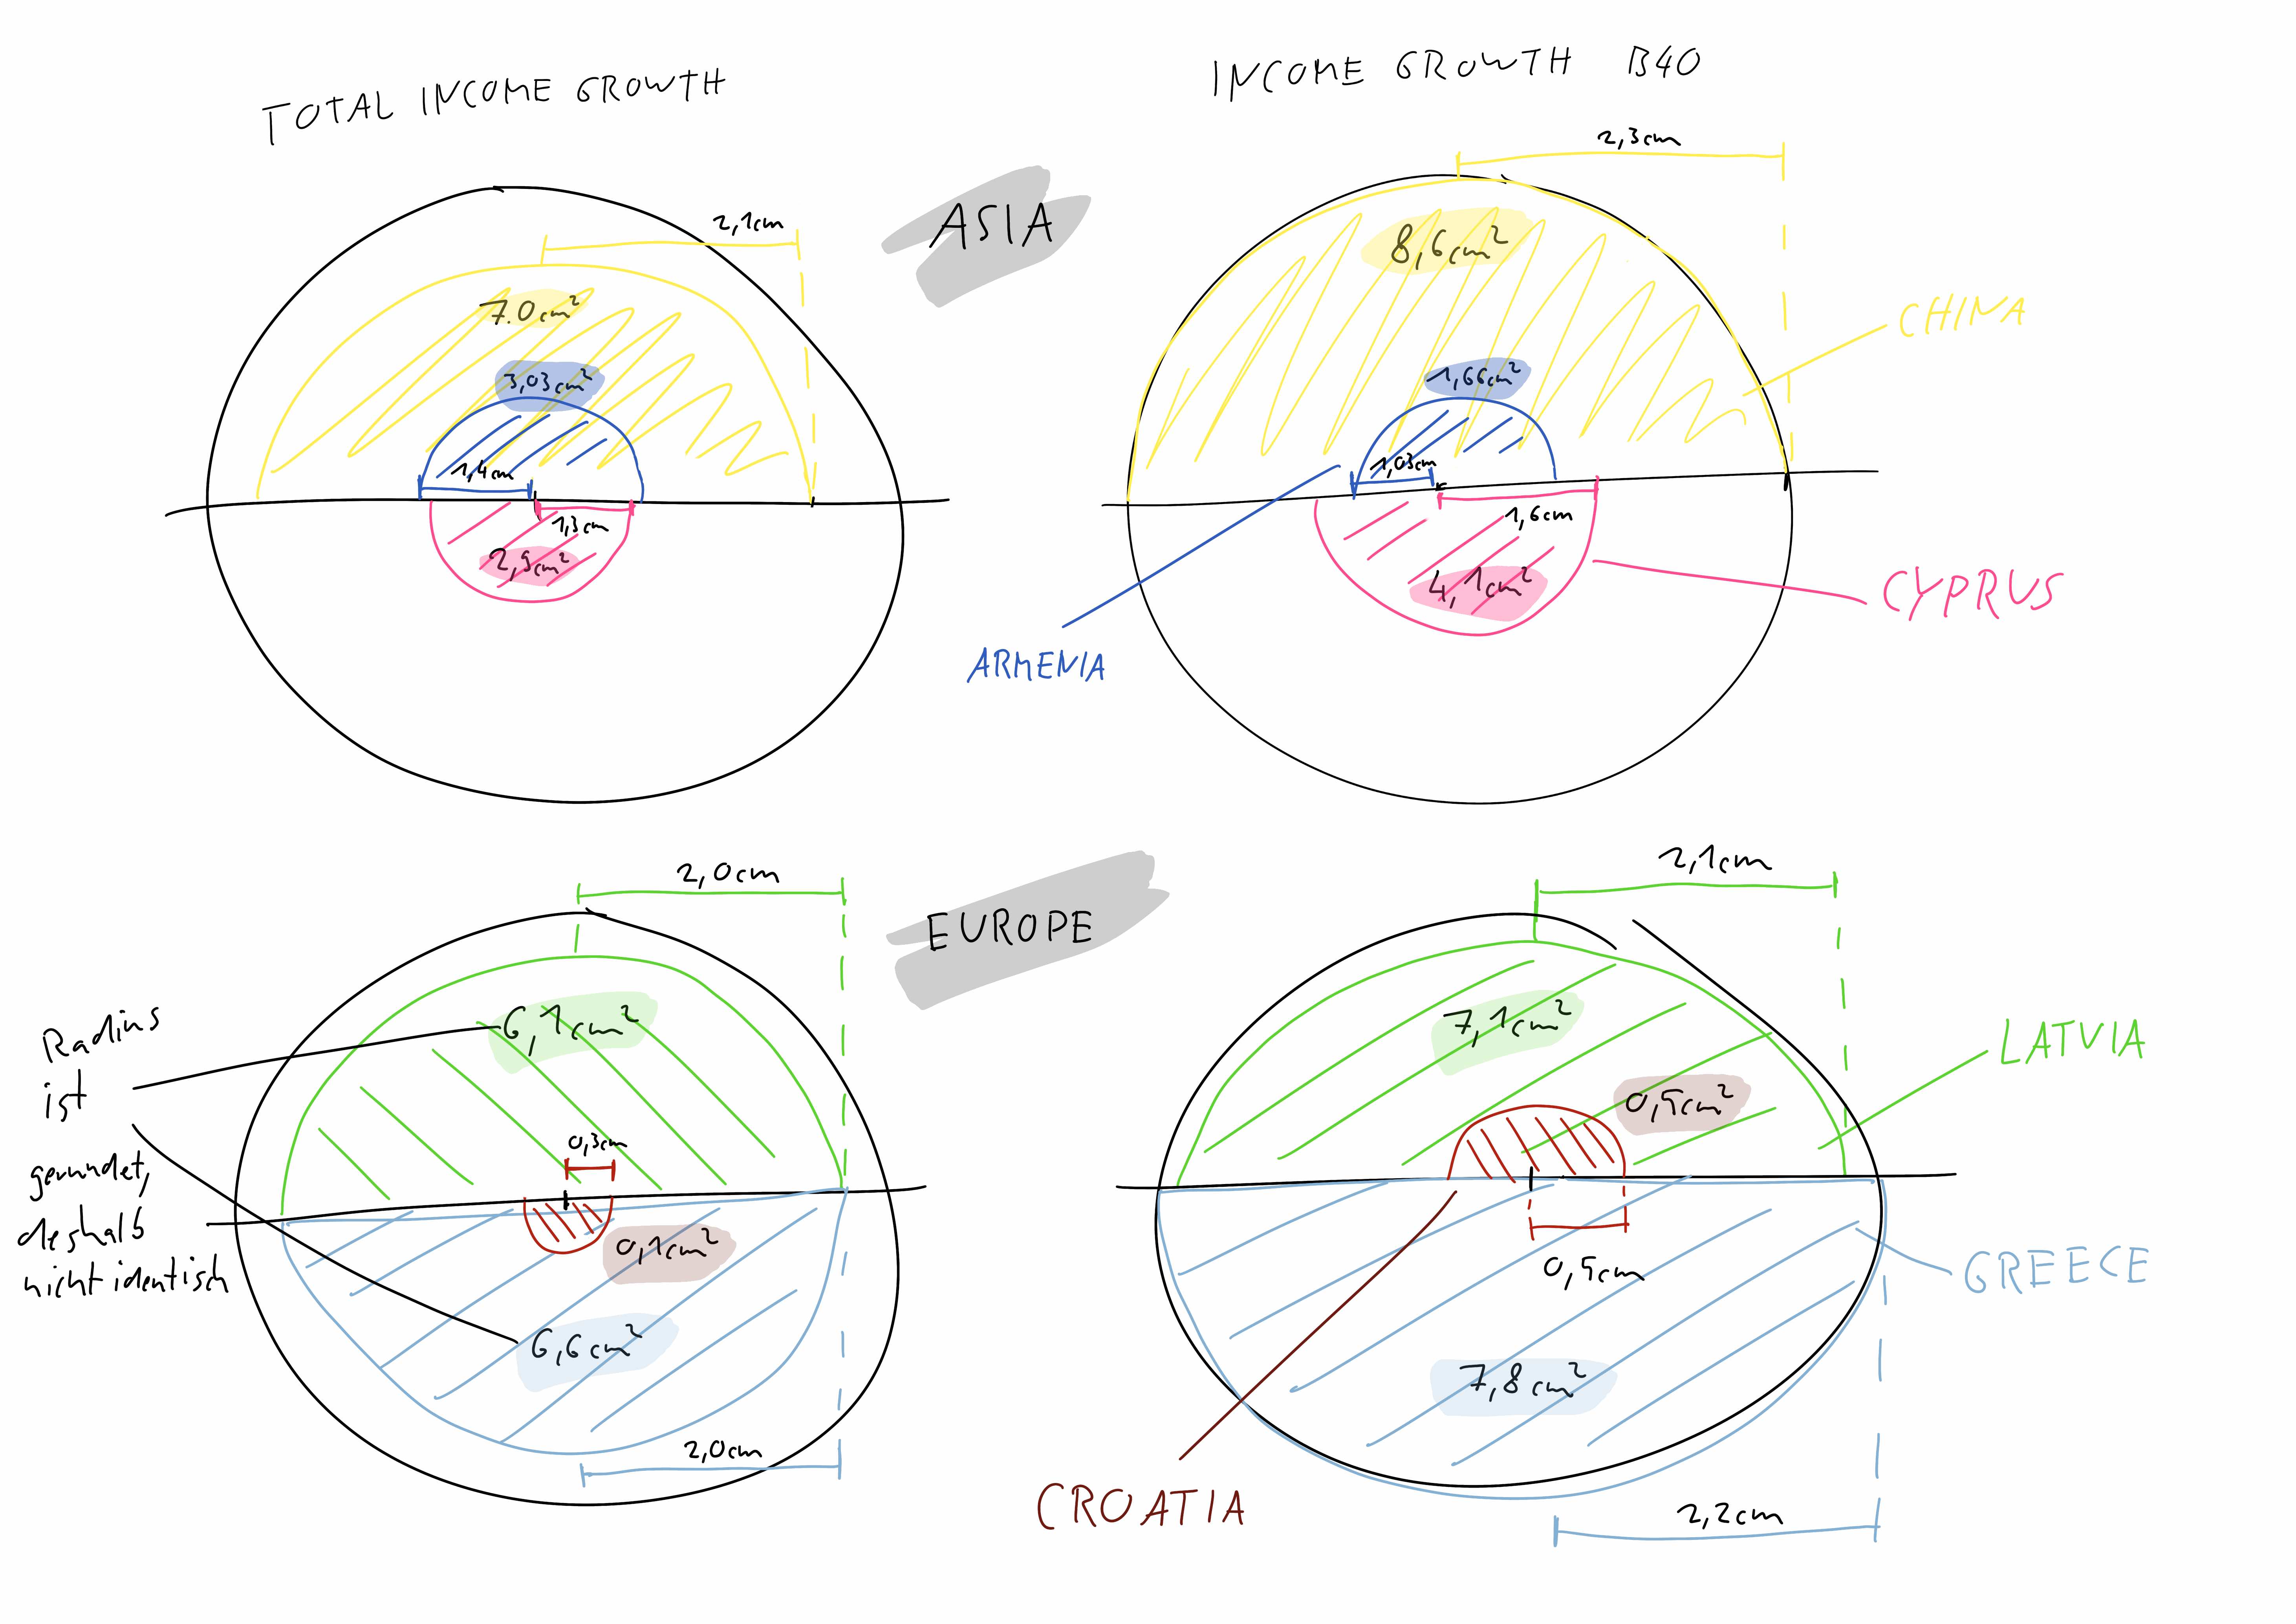
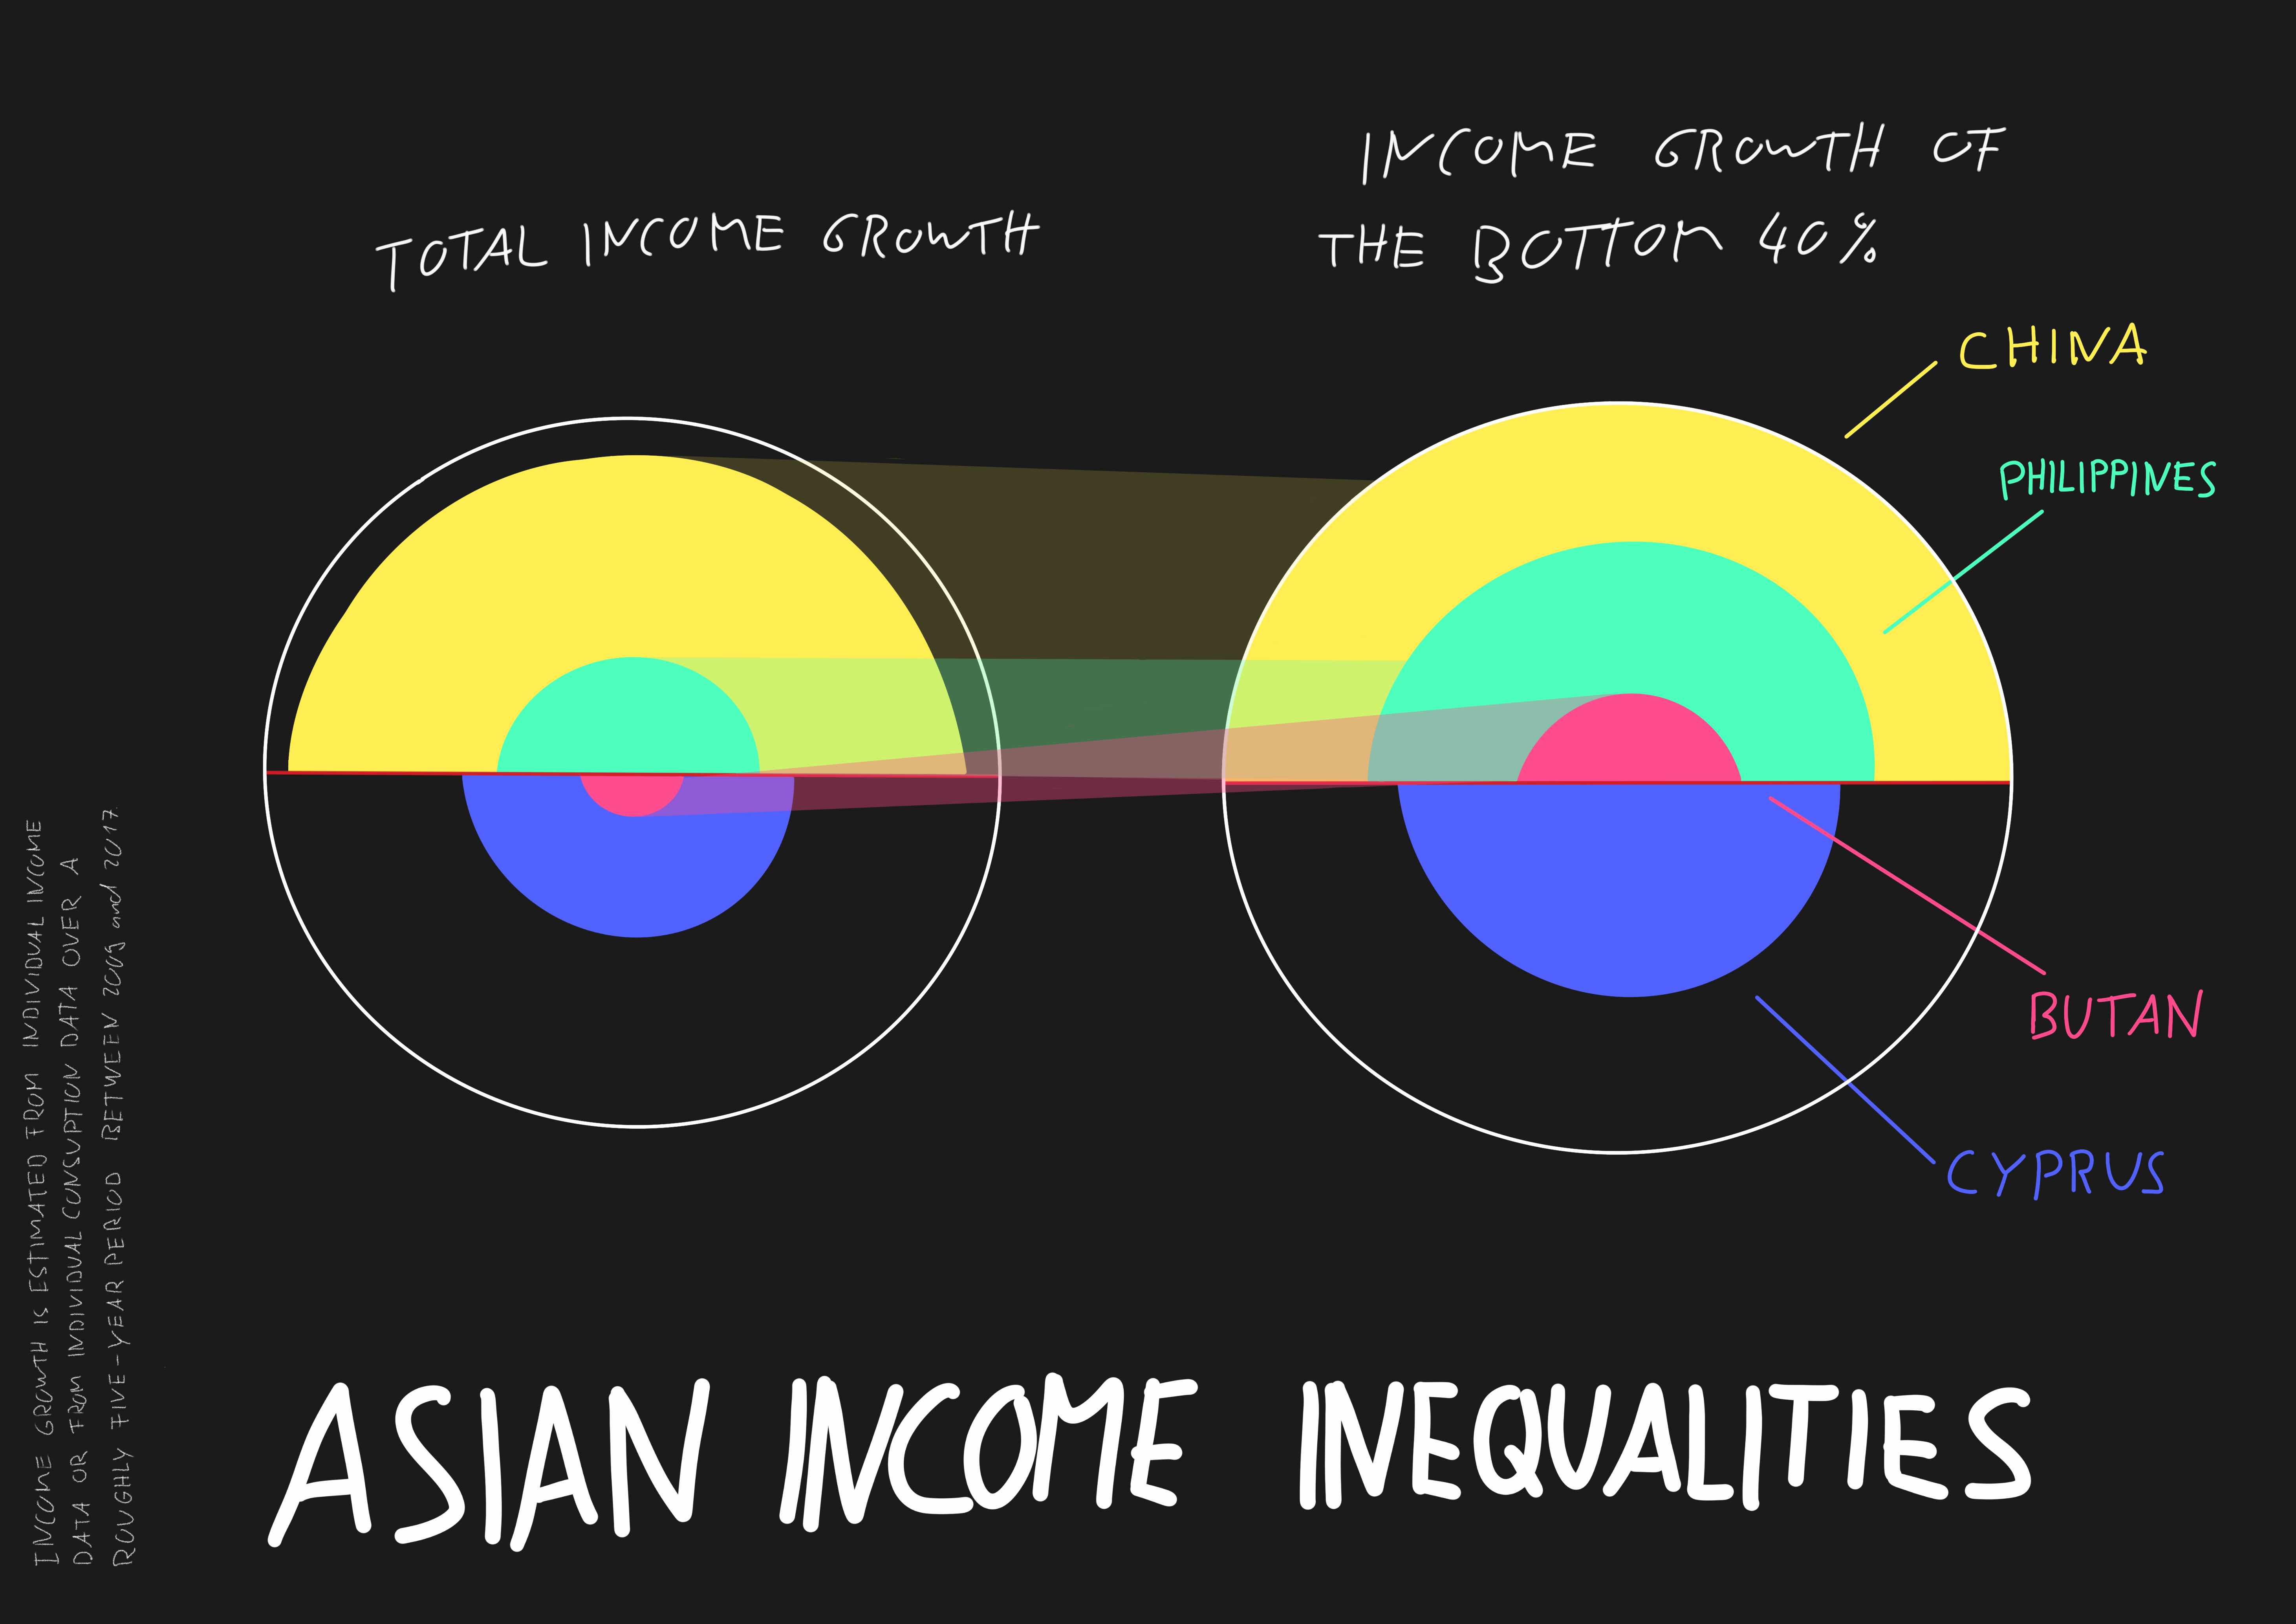
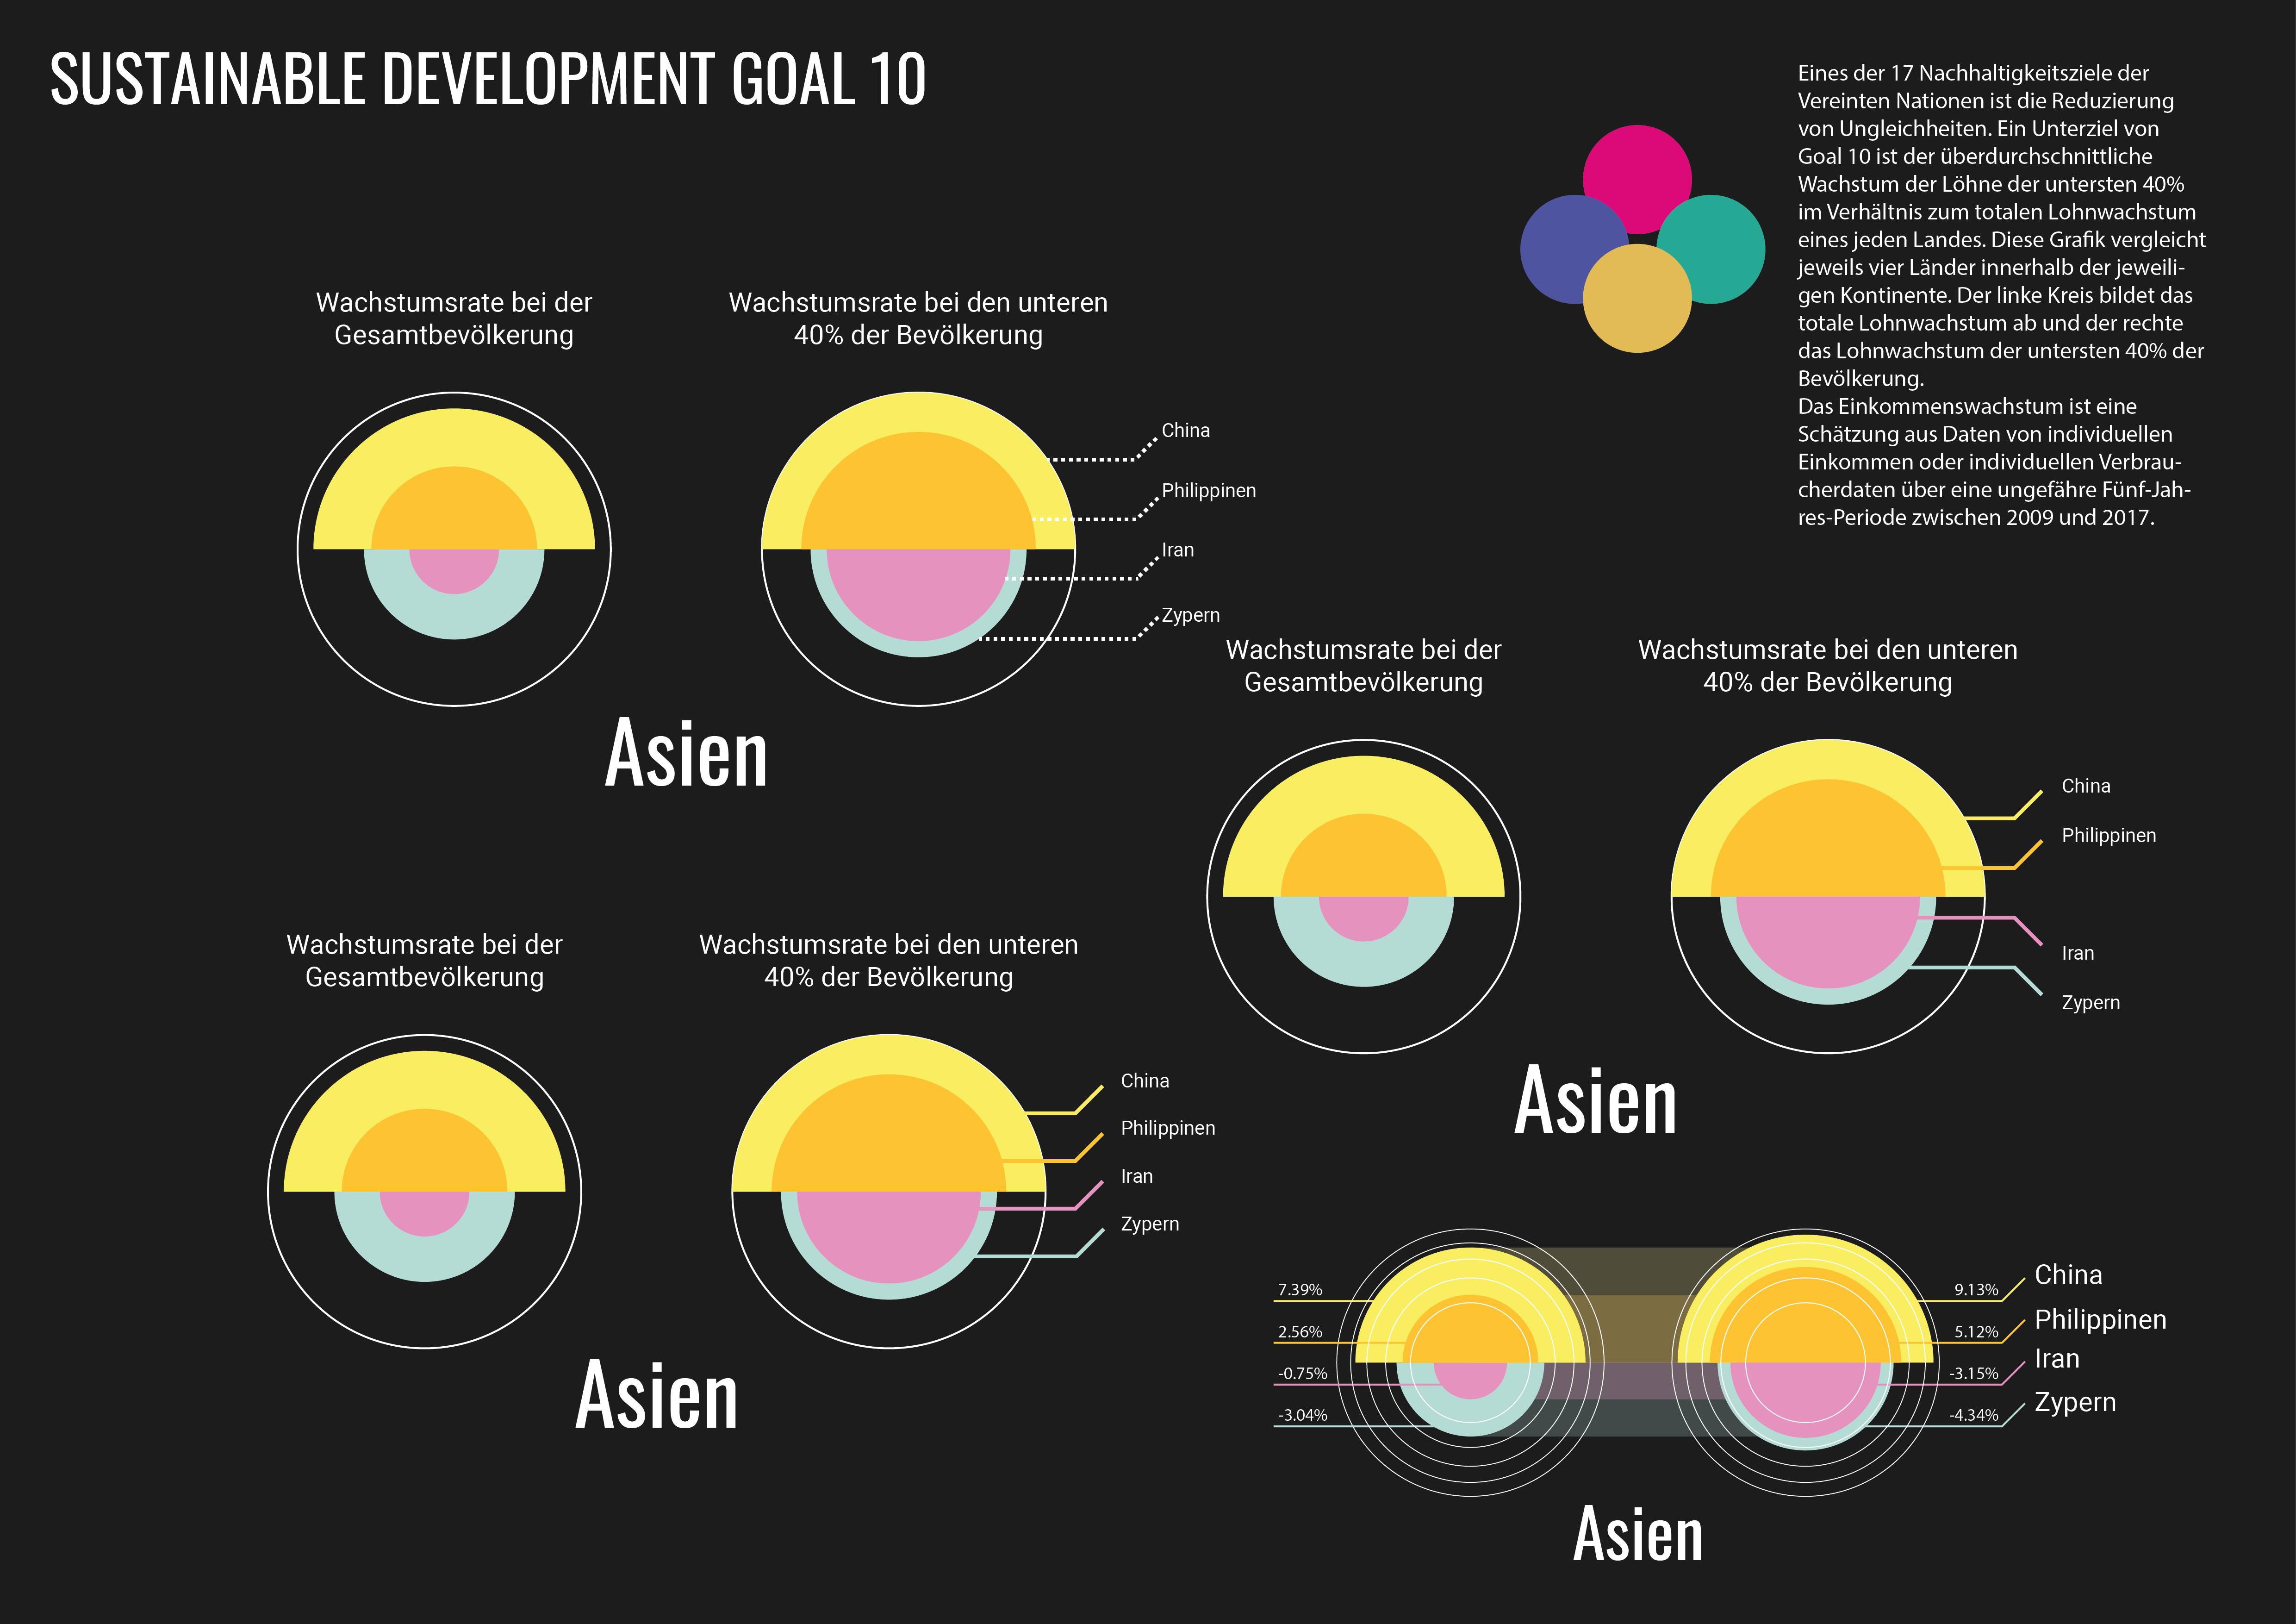
The 17 Sustainable Development Goals of the United Nations are a call to action for all countries and put the fight against poverty and inequality as well as for sustainable development and environmental protection on the same agenda. For this project, I chose goal number 10 with the main Goal of reducing inequality within and among countries and created a visualization for it. I experimented with different techniques until I found a way to represent the inequalities mentioned in Goal 10. One of the United Nations' "17 Sustainable Development Goals" is to reduce inequality, numbered as Goal 10.
This chart compares four countries on each continent. The right-hand circle of each continent shows the growth rates of the bottom 40 percent of the population and the left-hand circle shows the growth of the total population. Income growth is estimated using individual income data or individual consumption data over a period of about five years between 2009 and 2017.
Tech Stack
- Adobe Illustrator
- Tableau and Excel
- Procreate
Contribution
- Concept, Research, Design - Simon Müller